

Because we are living so much of our lives online, it’s never been easier for companies to access real behavioral data about what people do, when they do it, how they do it, and how often they do it. Big, quantitative data can answer these questions in real time based on observed (not interview-based) data and has revolutionized market research in the past decade.
However, there remains one hugely important question that is largely outside the reach of big data approaches: the question, “Why?” Why do people behave in a certain way, buy a certain product or service, or hold a certain belief? As we all know, this is where the “thick data” that qualitative research generates still has a very important role to play from an insight and decision-making perspective.
Having said that, qualitative research naturally comes with its own set of strengths and weaknesses. Among the latter, the most important is perhaps the lack of width or scale. There is, after all, a limit to how much you can safely generalize about the wider target group based on ten to fifteen in-depth interviews, two to three focus groups, or even an online community.
For that reason, the best research designs have always sought to integrate qualitative and quantitative sources and perspectives, either sequentially or in a mixed-method design.
One such mixed-method approach that we think deserves much more attention in the research community is a method coming to be known as “active sensemaking.” For various reasons that are beyond the scope of this article, active sensemaking remains to this day rather unknown beyond a small core group of practitioners. However, new digital platforms are now available, making it relatively easy to conduct and report active sensemaking-based studies.
Background: A Method Deeply Rooted in Human Behavior
Sensemaking is larger than any methodology or platform—it is, we would argue, how human beings evolved to navigate in a VUCA (Volatile, Uncertain, Complex, Ambiguous) world. As a methodology, active sensemaking harnesses and leverages the natural human ability to notice patterns in our environment, adding meaning to those patterns to generate insights, and provide a foundation for decisions and actions.
How do human beings do that? By telling stories. We are hardwired to tell stories and to respond to stories. We constantly tell stories to understand ourselves, others, and the world we live in. We respond to stories because they cultivate emotion and a sense of connectedness—a community. As Jonathan Gottschall, the author of The Storytelling Animal: How Stories Make Us Human put it, “We are, as a species, addicted to story. Even when the body goes to sleep, the mind stays up all night, telling itself stories.”
Active sensemaking takes the same principles and makes them scalable. This is where the mixed-method approach comes into play. First, the participants are asked to share a story or anecdote about an experience via one or more open-ended question prompts. They are then asked a small number of quantitative follow-up questions. The follow-up questions are intentionally ambiguous, designed to allow the participant to provide context and meaning to the narrative they just submitted with no “right” or “wrong” answers.
This approach has three benefits:
- Reduction of expert bias. The person sharing an experience is best able to make sense of their own experience. The principle of reducing expert bias through “self-signification” is a key tenet of active sensemaking.
- Participant empowerment. The participants themselves not only choose what their narrative will be about (within a broad, open framework set by one or two prompting questions), they alone assign meaning to their own narratives.
- Visualize patterns. The structured responses can be used to identify and visualize patterns in the narrative data.
Methodologically speaking, active sensemaking is closely aligned with complexity thinking, which sees human systems (ranging from small teams to entire organizations to whole societies) as “complex adaptive systems” (CASs). CASs are complex because each system and its parts are interconnected and interdependent. Further, CASs are characterized by being in a state of continuous change, in which the multitude (literally infinite) lines of cause and effect are impossible to discern except retrospectively. So a CAS is ultimately unpredictable. Active sensemaking emerged from this theoretical framework as a method to understand and make sense of complex systems and situations.
Active Sensemaking in Practice
Active sensemaking is, in effect, more like an ethnographic inquiry, rather than a statistical survey. The questions are designed to be ambiguous and open-ended. There are no “right” or “wrong” answers and thus no way to “game” the instrument.
Respondents are encouraged to provide more than one experience or story, assigning meaning to (or “signifying”) each experience through a small set of interpretive questions. The resultant data is therefore both qualitative (the respondents’ experiences) and quantitative (the respondents’ responses to the interpretive questions). In the dataset and the subsequent analysis, the stories remain linked to the interpretations. Thus, it is always possible to move back and forth between patterns of interpretation and the experiences underlying those patterns.
By capturing the contextually rich perspectives of individuals, meaningful patterns of the whole can emerge—but always rooted in the individual stories. With the subjective and the objective realities thus preserved, it becomes possible to discern patterns that need to be “dampened” and others that could usefully be “amplified.” Also, with the benefit of the shared stories, evidence-based hypotheses can be formulated for wise dampening and/or amplifying strategies—useful insights for nudging the organization in positive ways.
The active sensemaking methodology can also illuminate so-called “weak signals” that show up as smaller, anomalous patterns in the data. In a traditional survey, what would be ignored as extraneous outliers can provide invaluable early indicators via active sensemaking. By keeping the quantitative data points attached to their qualitative stories, there is the potential of finding answers to questions that an investigator would not think of, but which prove hugely relevant to the concerns of an inquiry.
A Case Study on Active Sensemaking: Leadership in the Canadian Public Sector
Developing and equipping leaders is a critical challenge for nearly every organization and institution. In 2014, a Canadian public service jurisdiction wanted to identify how they could improve their leadership development initiatives by identifying where there might be gaps and opportunities in their existing programs—a common concern.
The traditional approach to this kind of inquiry would be built around surveys and focus groups. There is no doubt as to their value. However, the Organizational Development (OD) advisors in this instance were concerned about the limitations of the traditional approaches and decided to use an active sensemaking methodology.
The respondents were invited to share their experiences of leadership within the organization and then answer some questions about the experience that they shared—not about the organization as a whole, but very narrowly about that one experience. Moreover, once they shared and interpreted an experience, they were invited to share another; as many as they liked.
“Sensor” Design
Using active sensemaking, the public service organization created an instrument (a “sensor”) to invite respondents to share their experiences of leadership in the organization. Like most active sensemaking instruments, the leadership inquiry had four main sections:
- a set of prompting questions to invite an experience or story
- graphic interpretive questions
- multiple-choice interpretive questions
- demographic questions

Prompting Questions
In the leadership sensor, respondents were shown nine generic workplace images—positive, negative, and ambiguous—and were invited to think of and then share an experience they had working in the organization. The only purpose of the images was to provoke memories of experiences—good, bad, neutral. The image itself wasn’t important, all that mattered was that respondents were thinking of something specific: “…an experience you have had working with [organization]—a specific situation that happened to you or that you witnessed or know about.”
Similar sensors might have a prompting question like: “Imagine you are with a friend at your local coffee shop. Your friend is thinking about applying for a position where you work. What is a story or experience you might share with your friend to encourage or to discourage their applying for a position? Please share that story.”
It is important that the question was not directly about leadership. A direct question would be gameable—inviting rewarding or punishing answers. By being oblique, the respondent is encouraged to provide simply what is top of mind.
Oftentimes, there are two or three prompting questions with a view to provoking a wider variety of experiences. The respondent can indicate which question they are answering, providing potentially interesting data around how they respond to the prompts.
Interpretive Questions
Once respondents had shared their experiences, they were invited to think about the meaning of that story. This is an important differentiator of active sensemaking. The interpretive questions are not about abstracted opinions in general, but quite narrowly about what the respondents have just shared.
In the leadership sensor, the first interpretive question asked them to give a title to their story—a headline. This is the beginning of assigning some meaning that the story has for them, as their story.
Graphic Interpretive Questions
The next few questions involved interacting with a few graphic images. There were two varieties: triangles and sliders.
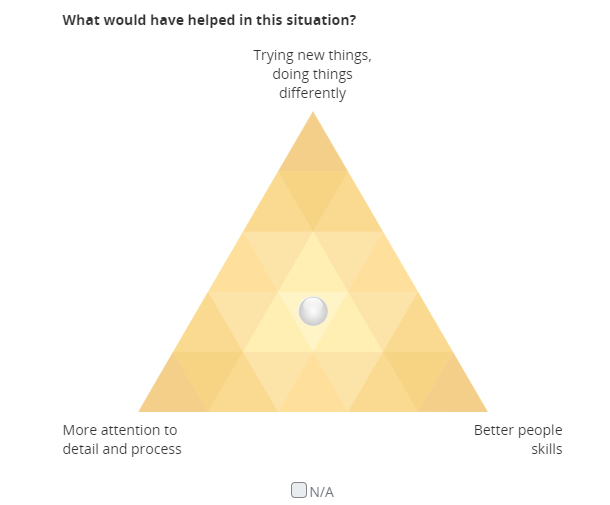
In triangle questions (see diagram B), the respondent is presented a triangle with each of the three corners labeled, denoting three distinct qualities or characteristics. Inside the triangle there is a ball that the respondent moves to a place in the triangle that seems a good fit with respect to the experience that they shared. If none of the three points are relevant to the experience, the respondent can choose N/A for not applicable.
By design, the three data points on a triangle are all positive, all negative, or all ambiguous (neither positive nor negative). Importantly, all three points could be equally applicable—i.e., the ball could be in the center if all three conditions were equally applicable to the experience being considered.
In the leadership sensor, one of the triangle questions asked was, “What would have helped in this situation?” The three points on the triangle were: “More attention to detail and process;” “Trying new things, doing things differently;” and “Better people skills.” A respondent, thinking about the experience they shared, would decide how to weigh their answer between those possibilities, including deciding whether or not the question was relevant to their experience.
Like the triangles, slider questions (see diagram A) require a respondent to move a ball, but this time between two points on a line, sliding the ball toward one end or the other or, like the triangles, checking N/A. Sliders are not Likert scales. Their end points typically are expressed as extremes—whether over-the-top positive qualities or exaggerated negative qualities.
Thus, for example, in the leadership sensor, one of the four slider questions asked was: “Concerns around the risk of failure were…,” with “Excessive and paralyzing” on one end and “Absent and reckless” on the other.
Multiple Choice Questions
Accompanying the interactive graphic questions are carefully-considered multiple choice questions (MCQs). These also refer to the story that was shared, inviting the respondent to indicate which of a range of MCQ choices best describe their experience.
In the leadership sensor there were six MCQs, together providing more information about how a respondent made sense of their experience. One MCQ, for example, asked about the emotional tone of the experience. Having the respondents assign emotional value to their own stories is a key part of the self-interpretive phase.
Data Collection and Analysis
After testing and revising the instrument through several iterations, the sensor was released to the organization, with every employee receiving an invitation to share their stories via the link that was provided. After a collection period of about six weeks, about 10 percent of the staff completed sensors, with many submitting multiple experiences. All in all, more than 700 completed sensors were submitted.
The process of data analysis involved two stages—one internal to the group of OD project leads and the other external, involving a diverse but representative group of organization employees. First, in the internal stage, the OD project leaders dove into the data, using the answers to various questions as filters to look at responses to other questions. For example, the impact and job classification questions could be used to look at response patterns in the “What would have helped in this situation?” triangle. Overall, there could be 700 dots in the triangle (less the number of N/As). But how many were associated with negative versus positive impact? Or with job classification? Or both? These kinds of filter combinations could be toggled back and forth to discern what kinds of patterns might emerge.
This exploration of the graphic data generated questions and hypotheses around what looked to be interesting and potentially relevant and important patterns. At that point, the data points could be matched with their stories, to add a rich layer of context. If, for example, a group of dots in one corner of a triangle seem predominantly associated with negative impact MCQ choices, those dots could be selected to reveal all the stories for which those dots are interpretations. Thus, it becomes possible to read the stories for further qualitative insights into the quantitative patterns, leading to refined and nuanced insights into issues being considered.
Second, the external stage involved a similar exploration of the data, but now drawing upon the wisdom and experience of a representative sample of the public service employees. About forty individuals, representing a cross-section of the organization, were brought together for a daylong dive into the data. These individuals were presented with digestible portions of the data (drawing on the work of the first stage) and led through a facilitated process to look for patterns and form hypotheses around what the data might suggest regarding the experience of leadership within the organization. This was first done without reference to the stories. Then, after initial hypotheses had been formed, the group was presented with the experiences that lay behind the patterns they had discerned. Reviewing and drawing upon the experiences and stories, the group revised their hypotheses as seemed appropriate. The last part of the day was given to crafting recommendations for leadership development, drawing upon what they had seen in the data.
Key Findings
In the end, the data patterns of that active sensemaking initiative led to some important findings, including the following from the final report:
- Leadership: The data showed a very strong correlation between collaborative leadership and empowered, engaged, and hopeful employees. The obverse is equally strong: authoritative, top-down leadership was strongly correlated to discouraged, disappointed, and angry employees. Exploring the patterns and stories revealed a recurring theme of top-down management that was experienced by employees as stifling and as having a negative impact on service delivery and employee engagement.
- Innovation: The data patterns and associated experiences revealed another unambiguous set of correlations. Positive outcomes were strongly associated with “let’s try something new and different,” while negative outcomes were strongly associated with “we have always done it this way,” or “let’s just get it done.” This correlation became particularly significant given that some 61 percent of respondents associated their experiences with a lack of openness to innovation.
- Relational intelligence: The interpretive patterns and the experiences that lay behind them also pointed to the critical importance of what we are calling “relational intelligence”—i.e., the ability on the part of teams and leaders to effectively and constructively manage differences, engage in constructive conversations, and generally foster healthy and productive workplace interrelationships.
None of these findings were particularly surprising or unexpected; however, the active sensemaking initiative provided hard data behind what up to that point was only intuited. Moreover, the data revealed patterns that needed to be dampened and others that should be amplified, along with generating evidence-based hypotheses about how that could be accomplished.
Active Sensemaking Tools and Platforms
Two active sensemaking online platforms are currently available to practitioners, namely Spryng (https://spryng.io) and SenseMaker (https://sensemaker.cognitive-edge.com). In addition, DIY tweaks (e.g., using open-source JavaScript code) can be added to standard survey tools to allow them to display certain input formats essential to active sensemaking studies, such as the graphic interpretive questions.
Wrap-Up
For the dedicated practitioner with firm roots in complexity thinking, active sensemaking is a uniquely helpful way to conduct inquiries into human system contexts where it is important to keep both qualitative and quantitative insights connected and in view across all scales.
Active sensemaking has historically been used mainly in information/knowledge management and in the leadership development and employee feedback space. Our case story was indeed focused on leadership development.
However, first, one does not need to be an adherent of complexity theory to find active sensemaking useful as a method. Some practitioners use active sensemaking simply as a way to do narrative inquiry. The combination of narrative data directly linked to structured data is where the uniqueness of this method resides—regardless of theoretical standpoint.
Second, clear use cases exist beyond the subject areas mentioned above, anywhere there is a human “system” (an organization, team, community, city—any identifiable collection of humans) about which or within which there are complex challenges or questions.
As we hope we have shown in this brief introduction, we believe active sensemaking has a place in the toolbox of any research practitioner who is looking for thick data and actionable insights into the “why” of human behavior.
Be the first to comment