

By Robert Walker, CEO & Founder, Surveys & Forecasts, LLC, Norwalk, Connecticut, rww@safllc.com
Why a Quant Lens column in VIEWS?
Welcome to QRCA VIEWS’ inaugural Quant Lens column, focusing on the many different aspects of quantitative marketing research. This column is intended to provide accessible, easily digestible explanations of quantitative concepts—but geared to you, the qualitative researcher. The idea for this column originally sprang from a seminar I gave on Quantitative Methods for Qualitative Researchers at the January 2024 QRCA Annual Conference in Denver. That seminar (attended by an enthusiastic group of qualitative researchers) generated a lot of interest—and questions—about how to conceptualize and execute quantitative research properly.
Equally important, many QRCA members are also full-service research consultants for their clients. You have probably been working with many of your clients for years, and they rely on your expertise to address a wide range of marketing issues by identifying new insights. As a result, you may find yourself responsible not only for qualitative projects but also for hybrid (i.e., “mixed methods”) research paths that involve both a qualitative and quantitative phase. Or, perhaps in the future, you would like to do more of these kinds of projects to expand your skill set.
Well, fear not! You already have the analytical skills needed to design, gather, and synthesize qualitative data from both individuals and small groups. Conducting larger-scale quantitative projects simply extends your skills to larger target populations and user segments. That’s why you will benefit from understanding the principles behind determining the right design and appropriate sample sizes for a variety of quantitative research studies. With an ever-growing array of DIY, neuroscience, and AI-supported platforms, your ability to offer well-reasoned research approaches to your clients will be appreciated and valued.
In this issue, we’ll tackle some basic challenges in determining the right sample size for your quantitative projects, understanding the role of statistical confidence, and a little bit about experimental design. We will also explore the trade-offs between precision and costs and provide guidelines for determining when sample sizes are “close enough.” We’ll cover some typical use cases, such as general opinion studies, attitude and usage studies, segmentation research, idea screening, and concept testing.
Qualitative or Quantitative: Do We Care?
For simplicity, our research design and sample size guidance apply primarily to what is known as “quantitative primary research.” Primary research typically means a proprietary survey commissioned by a specific client and designed to address business or marketing issues for that client. This is in contrast to “secondary” or “syndicated” research, which are audits or surveys that are executed once and then shared by multiple clients (e.g., an “omnibus study”).
Primary research can be further distilled into “exploratory” designs (i.e., smaller samples with more flexible data collection) and “confirmatory” or “evaluative” designs (i.e., larger samples with more structured data collection). The term “qualitative” is typically associated with exploratory research, while “quantitative” is typically associated with confirmatory research—but there are exceptions. For example, large-scale quantitative studies are often conducted to explore new market opportunities, such as to discover unmet needs or identify segments. Conversely, in product testing, there may be a small number of highly trained sensory experts who explore and evaluate new products using comprehensive and precise numeric responses. The line between qualitative and quantitative can sometimes be blurry.
In addition to surveys on business or marketing topics, there are other types of survey research that share the same characteristics, in that they require certain levels of precision that impacts sample size, statistical confidence, and cost. These include surveys of public opinion, political polling, and consumer or business sentiment (e.g., monthly surveys of consumer confidence). While these examples may fall outside a pure primary research definition, they still require the same thought process and approach needed in most proprietary studies.
Importantly, as researchers, we are not in the cookie-cutter business: every client and every business or marketing problem is different. It will be up to you to recommend the path forward that makes the most sense for your client.
Setting Research Objectives to Guide Study Design
Problem definition is the most important piece in mapping out your quantitative marketing research plan. All the parameters of your quantitative design will flow from this, including the overall design, sample specifications, required sample sizes, and the precision needed for business decision-making. Pay close attention to the problem you are being asked to solve. You will typically see the historical context for the project in a “background” or “overview” section of the research request. Most research studies are initiated by a series of client events that led to this opportunity. The background section should provide good context and guidance about the specific issues being faced by the client.
 What Kind of Study Will You Need?
Keep an eye out for action standards. An action standard is a “go”/“no go” decision rule linked to your client’s objectives and is based on questions in the survey you ultimately execute. So, if there is an explicit “action standard” associated with the research, you’ll need to shift your focus toward a research design that assesses reactions to ideas, concepts, products, or positionings. For example, a new product idea might have to exceed a known benchmark on purchase interest for the R&D team to proceed to the next phase of product development. If your research shows that the product exceeds the benchmark, the next phase is a “go.”
Conversely, not all research has or needs an action standard. If the research being requested is largely descriptive or diagnostic in nature, an action standard is not warranted. Perhaps your client needs to identify possible opportunities in a new geographic market or discover new and untapped segments. In this case, the research, while quantitative, is primarily exploratory, with the intent to understand and learn about a category, products, or users—yet a large sample may be required.
Large exploratory studies might involve understanding consumer needs, desired end benefits, or buyer behavior (i.e., brands x users x usage situations). Some research may focus on identifying opportunities where new products might be developed (i.e., “white space” opportunities). Other studies may focus solely on whether a brand’s equity can be extended into other (closely or distantly related) categories that share the same imagery or values.
Use Cases: Strategic Research
Large strategic studies—such as market entry strategies, market structure, or brand assessment and repositioning research—aim to inform significant business decisions. These studies require high precision and reliability, typically necessitating larger sample sizes. For large, nationally representative market studies that will be used to identify opportunities as well as key subgroups for analysis (such as identifying unique segments), you would be well-served to recommend sample sizes that are large—samples of 1,200–1,500 respondents are typical and may go as high as several thousand depending on the need for geographic or demographic coverage. This extends not only to demographic subgroups but hypothesized segments or other groups of interest to the client. Even with large samples, having many subgroups to analyze can quickly cause large sample sizes to dwindle into smaller subgroup sample sizes. For example, if your client assumes that there are five segments in a 1,200-respondent survey, there might only be 240 respondents per segment (assuming that they are evenly distributed).
Examples of large-scale strategic studies might include:
- A global consumer company is considering entry into a new geographic region. Little is known about this market, and there is a significant need to understand market potential, consumer preferences, competitive landscape, and optimal entry strategies. The client hypothesizes that at least two segments might be targets that are right for acceptance of their brands.
- A well-established U.S. packaged goods company is considering repositioning one of its mature products to target a younger demographic. The company needs to understand current brand perceptions, identify new positioning opportunities, and evaluate the potential impact on sales and market share among a younger age target.
- An awareness and usage (A&U) study is needed to explore consumer behaviors, preferences, and attitudes for a category where the company does not currently compete. The results of the A&Us will be to understand how consumers interact with competitive products and services, their satisfaction levels, and potential areas for improvement before an acquisition is made.
 Use Cases: Evaluative Research to Screen Ideas or Test Concepts
Idea screening and concept testing are essential stages in product development, where potential ideas or concepts are evaluated for feasibility and appeal so that a company’s new product pipeline can stay full. Much like market studies, these studies often require larger samples to minimize respondent burden by having respondents see only a subset of the full complement of concepts under consideration. In these scenarios, “partial factorial” designs are effective uses of the sample (i.e., showing five out of a possible 25 ideas being evaluated). This allows a client to gather solid general demographic information from the larger sample size while getting adequate (or “good enough”) evaluations and diagnostic feedback on each concept. Use cases for idea screening and concept evaluation might include:
- Early-Stage Screening: Initial screenings can use small-to-large sample sizes to identify promising idea “kernels” efficiently. These studies prioritize speed and cost-efficiency over depth of evaluation. They are also often followed by a qualitative phase to gather more insight.
- Validation Stage: As ideas progress, larger and more representative samples are needed to validate findings and ensure that the concepts resonate with the target market. Minimally, samples of 150–250 are commonly used in these designs.
- Iterative Testing: Multiple rounds of testing may be required, with sample sizes adjusted based on the stage of development and the precision needed. In these cases, action standards are routinely used.
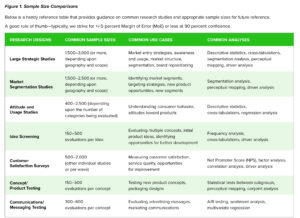
Below is a handy reference table that provides guidance on common research studies and appropriate sample sizes for future reference.
A good rule of thumb—typically, we strive for +/-5 percent Margin of Error (MoE) or less at 90 percent confidence.
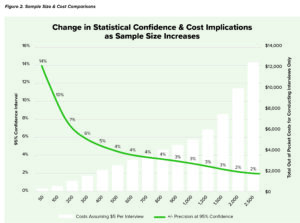
The Precision versus Cost Trade-Off
Higher confidence levels require larger sample sizes to ensure that the results are reliable and projectable to the larger population. This is because larger samples reduce the margin of error. However, as can be seen in Figure 2, as the sample size increases, the precision of the estimate improves—but the incremental statistical benefit of using a larger and larger sample size declines rapidly. For example, to double the precision from a sample of 100 (with a ±9.8 percent MoE at 95 percent confidence), we would actually have to quadruple the sample to 400 (±4.9 percent MoE at 95 percent confidence). This is why most national public opinion polls target a relatively precise ±3 percent margin of error, which requires a sample of approximately 1,200 respondents. To double this precision, a polling company would require 4,800 respondents—at quadruple the cost!
The trade-off between sample size, statistical confidence, and costs forces researchers to balance the need for higher confidence levels and precision with the practical constraints of time and budget. Selecting a sample size that provides an acceptable level of confidence while meeting the client’s specific research objectives should always be your goal.
 Sample Source & Data Quality Considerations
Excluding customer databases, the vast majority of consumer and B2B research studies today are conducted using online “opt-in” panel sources. There are many reputable providers of online respondents, including those who acquire sample from multiple sources and are effectively sample “aggregators.” While a detailed discussion of online panel data quality falls outside the scope of this article, my advice is to work with reputable companies with a proven track record in the research community.
Most sample providers are diligent about identifying duplicate or suspicious responses and perform identity verification steps—but please conduct your own data validation steps, too. You can limit suboptimal behavior by reviewing open-ended responses, asking questions to catch inattentive respondents, identifying speeders, and asking opposing attributes in grids.
Just remember that biases exist in all forms of research and the samples used to conduct them: some are obvious (e.g., convenience samples), while others are hidden (e.g., nonresponse bias, biased language, biased context). The more you are aware of potential sources (and impact) of bias, the better researcher you will be.
Summary
Understanding the relationship between sample size and statistical precision is crucial for qualitative researchers transitioning to quantitative projects. Sample size directly influences the accuracy and reliability of survey results, with larger samples providing greater precision and smaller margins of error. This precision is essential when making significant business decisions, such as market entry strategies or brand repositioning. However, researchers must also consider the trade-offs between costs and precision.
Larger sample sizes, while offering higher confidence levels, increase costs and resource demands. By balancing the need for precise, reliable data with practical budget constraints, researchers can design robust studies that provide actionable insights. Tailoring sample sizes to specific research objectives—whether for large strategic studies, idea screening, product testing, or messaging evaluation—ensures that the findings are both meaningful and cost-effective. This approach enables researchers to make informed decisions, leveraging quantitative data to complement and enhance their qualitative insights.
Terms to Remember When Designing Your Research and Sample Plan
Let’s review some of the fundamental terms and concepts in determining sample size that are helpful in designing effective quantitative studies. Here are the key ones:
- Population: This is the entire group of individuals from whom the researcher will draw the sample—and for projecting our conclusions. In most marketing research studies, the “population” is all potential customers in a specific market. When the population is relatively small, we may need fewer respondents to properly represent it, and we may need to apply a formula designed to adjust for these “finite populations.”
- Sample: This is the subset of the population that you will select for your study through screening questions (or perhaps using other tools, such as a scoring algorithm to identify user segments if you are following up from a previous quantitative phase). The goal in screening for our sample is to be large and representative enough to have confidence in generalizing our study findings to the larger population.
- Margin of Error (MoE): This is a range in which we expect the true population value to exist for a given level of confidence. If, for example, we are conducting a market study on carbonated soft drinks, and 25 percent of our sample drinks Sprite once a week, we could simply say that 25 percent of soft drink consumers drink Sprite—but we would be omitting some needed details. To be more accurate, we would say that we are 90 percent confident that 25 percent of category consumers drink Sprite ±3 percent (our margin of error).
- Confidence Level: This is the probability that the margin
of error includes the true population value. The confidence level addresses the possibility of a false positive (i.e., we incorrectly conclude that there was a difference when there was none). Confidence levels are typically set at 90 percent or 95 percent. Continuing with our Sprite example, we want to be 90 percent confident that 25 percent of carbonated soft drink consumers drink Sprite. Given a ±3 percent margin of error, we would state this as “being 90 percent confident that the true population value is between 22 percent and 28 percent” (and 10 percent of the time, the true population value would fall outside this range). We also rely on confidence levels when comparing results between groups, such as comparing demographic groups on the performance of concepts or advertisements.